
21/2018
2018-07-13
Social Mood: Quarterly Summary
Indicators of social mood used in our research include evaluations of and forecasts for Poland’s economy and politics, respondents’ workplaces and their own household finances. In order to express the full dynamic of changes in social mood, this quarterly summary is presented in the form of mean assessments on a five-point scale from -2 to +2.
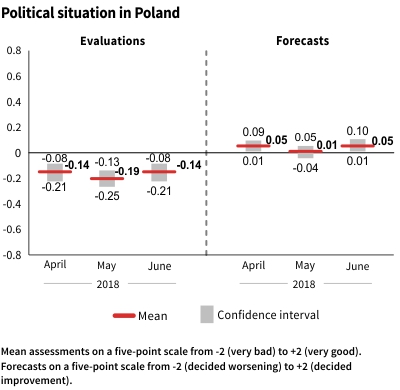
The second quarter of 2018 saw a stabilisation of both evaluations and forecasts of the political situation at the level of March of this year, which means they were slightly worse than in January and February. Mean assessments continued to have negative values, indicating a dominance of dissatisfaction over satisfaction, while, when it came to forecasts, the values were close to zero, suggesting a balance between pessimism and optimism.
|
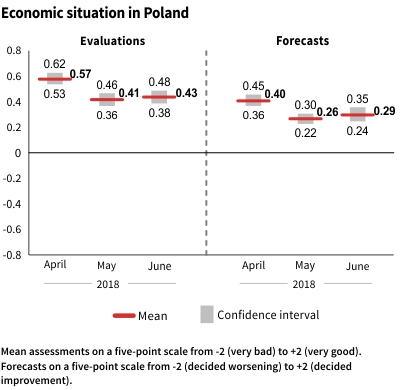
On the other hand, evaluations and forecasts of the economic situation have been on the plus side for many months. However, even they (apart from April, which saw a slight rise after earlier drops) turned out to be lower than at the beginning of this year.
|
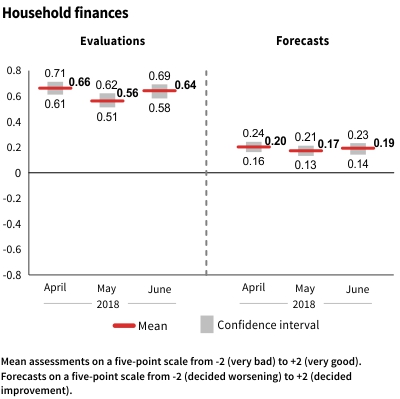
In the second quarter of the year, evaluations of the condition of respondents’ household finances remained at March levels, so somewhat lower than in January and February. Forecasts in this area continued to be less optimistic than assessments and have maintained a comparable level over many months.
|
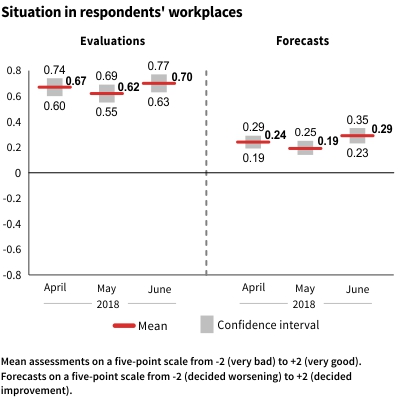
After very slight drops in April and May assessments and forecasts for the situation in respondents’ workplaces improved very slightly and were now close to those seen in the first quarter of the year. This indicates that most working people assessed the condition of the businesses that employ them positively and, on the whole, did not anticipate any meaningful change during the coming year. Should there, however, actually be one, it would more likely be positive than negative.
|
The above data comes from the ‘Current Events and Problems’ survey carried out during the second quarter of 2018.